Crunching The Numbers On Our Composite Score
When does it make sense to place an earnings trade?
Listening To The Data
In our last Exits post, I mentioned I would be crunching the numbers on our composite score over the weekend.
In this post, I’ll tell you what I found. First, a bit of a recap for new readers unfamiliar with our approach.
Our Current Approach
Recall that we’re using these ten factors when evaluating earnings trades,
LikeFolio’s earnings score based on social data. The higher the number, the more bullish, the lower (more negative) the number, the more bearish.
Portfolio Armor’s gauge of options market sentiment.
Chartmill’s Setup rating. On a scale of 0-10, this is a measure of technical consolidation. For bullish trades, we want a high setup rating; for bearish trades, a lower one.
Chartmill’s Valuation rating. On a scale of 0-10, this is a measure of fundamental valuation incorporating common rations like P/E, PEG, EBITDA/Enterprise Value, etc. For bullish trades, the higher the better the Valuation rating the better; for bearish trades, the reverse.
Zacks Earnings ESP (Expected Surprise Prediction). This is a ratio of the most accurate analyst’s earnings estimate versus the consensus estimate.
Zacks Ranking. This goes from 1 to 5, with #1 ranked stocks being their most bullish ones. They grade on a bell curve, so most stocks we see end up with their #3 (neutral) ranking.
The Piotroski F-Score. A measure of financial strength on a scale from 0-9, with 9 being best.
Recent insider transactions.
RSI (Relative Strength Index). A technical measure of whether a stock is overbought or oversold. RSI levels above 70 suggest a stock is overbought and and RSI levels below 30 suggest it’s over sold.
Short Interest.
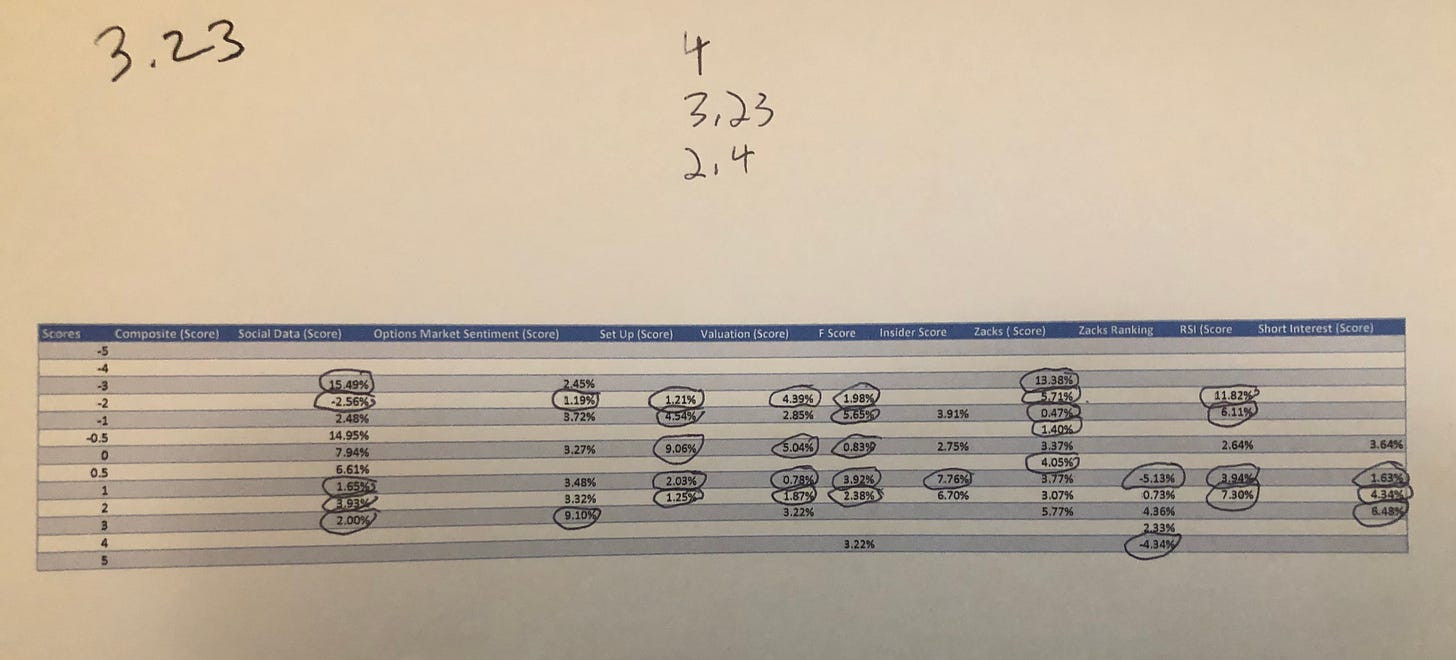
And we’re keeping track of each metric on a range from very bearish to very bullish, and tracking them and their performance in a spreadsheet, a snippet of which is below.
And we’re using their relative outperformance or underperformance versus all of the stocks that we’ve analyzed to adjust our weightings of each metric to determine which stocks we should be bullish or bearish on ahead of earnings.
Our Composite Score
Each weekend, after I update the spreadsheet, I print out a performance summary that looks like this.
The numbers at the top represent the average 5-day return of all the names we’ve researched in our sample, 3.23%, and numbers representing 25% more or less than that, 4 and 2.4%, respectively. I focus on returns that deviate from the average by at least that much, so, for example, if stocks with a “very bullish” rating on one of our metrics return 4%, on average, when I see a stock with that rating, I count that as a +1.25 when calculating our composite score. If it returned less than 2.4%, I add a negative number there, ranging from -0.25 to -2.6 based on current data. Adding up those positive and negative numbers over ten metrics for a stock gets us its composite score. In theory, the higher (more positive) the score, the more bullish, and the lower (more negative the score, the more bearish. But how has that worked out in practice?
Actual Performance By Composite Score
To figure this out, I sorted the composite scores similar to the way we sort each of the ten metrics: a composite score of 0 was 0, anything above 0 but less than 1 was 0.5, Anything equal to or above 1 but below 2 was a 1, and so on, with the reverse for negative composite scores.
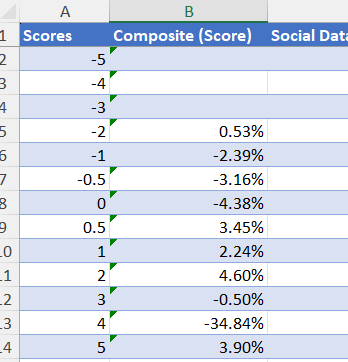
Here’s a summary of the 5-day performance data:
Takeaways From The Data
The -34.84% average return for composite scores in the 4 range is based on one data point: Snap (SNAP 0.00%↑) was the only stock in that range, and it plummeted after earnings, as you can see there. But my takeaways from the data above are these:
Bet against stocks with composite scores between 0 and -1.9.
Bet on stocks with composite scores between 2 and 2.9.
So that’s what I plan to do this week. We’ll re-run the data after this week, and adjust accordingly.


