Following The Data
In our trade alert posts, I summarize the process we use. If you’re not familiar with that, it looks like this:
Our Current Approach
Recall that we’re using these ten factors when evaluating earnings trades,
LikeFolio’s earnings score based on social data. The higher the number, the more bullish, the lower (more negative) the number, the more bearish.
Portfolio Armor’s gauge of options market sentiment.
Chartmill’s Setup rating. On a scale of 0-10, this is a measure of technical consolidation. For bullish trades, we want a high setup rating; for bearish trades, a lower one.
Chartmill’s Valuation rating. On a scale of 0-10, this is a measure of fundamental valuation incorporating common rations like P/E, PEG, EBITDA/Enterprise Value, etc. For bullish trades, the higher the better the Valuation rating the better; for bearish trades, the reverse.
Zacks Earnings ESP (Expected Surprise Prediction). This is a ratio of the most accurate analyst’s earnings estimate versus the consensus estimate.
Zacks Ranking. This goes from 1 to 5, with #1 ranked stocks being their most bullish ones. They grade on a bell curve, so most stocks we see end up with their #3 (neutral) ranking.
The Piotroski F-Score. A measure of financial strength on a scale from 0-9, with 9 being best.
Recent insider transactions.
RSI (Relative Strength Index). A technical measure of whether a stock is overbought or oversold. We’re looking for RSI levels below 70 for bullish trades and above 30 for bearish ones.
Short Interest.
And we’re keeping track of each metric on a range from very bearish to very bullish, and tracking them and their performance in a spreadsheet, a snippet of which is below.
And we’re using their relative outperformance or underperformance versus all of the stocks that we’ve analyzed to adjust our weightings of each metric to determine which stocks we should be bullish or bearish on ahead of earnings.
Our Spreadsheet Prior To Last Week
At the end of a week in earnings season, I enter the 5-day performance for all the names we researched that week, and print out the average performance of each metric, which looked like this before last week
The three numbers I scribbled at the top there are the average 5-day return of all of the stocks in our sample up until then (including data from last quarter), 4.07%, and a figures 30% higher and lower than that. Any return that’s within 30% of the average return I ignore for the purpose of this analysis, to try to filter out noise.
A Counterintuitive Result
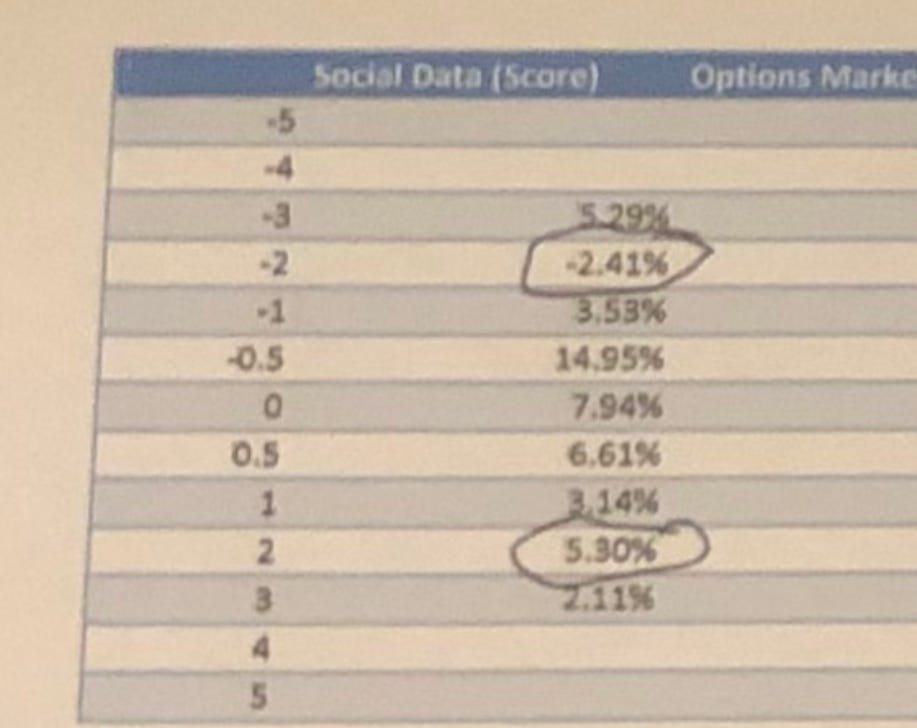
Here’s a closer look at the first column, social data.
The raw social data score is a figure between -100 to +100. In the spreadsheet, I convert that to a single digit numerical score, so that -1 refers to a raw social data score of between -20 and -39, -2 refers to one between -40 and -59, and -3 refers to one of -60 or worse. Note the counterintuitive result above: the average 5-day return for -2 social data stocks is -2.41%, but the average 5-day return for -3 social data stocks is +5.29%.
The Cheat Sheet
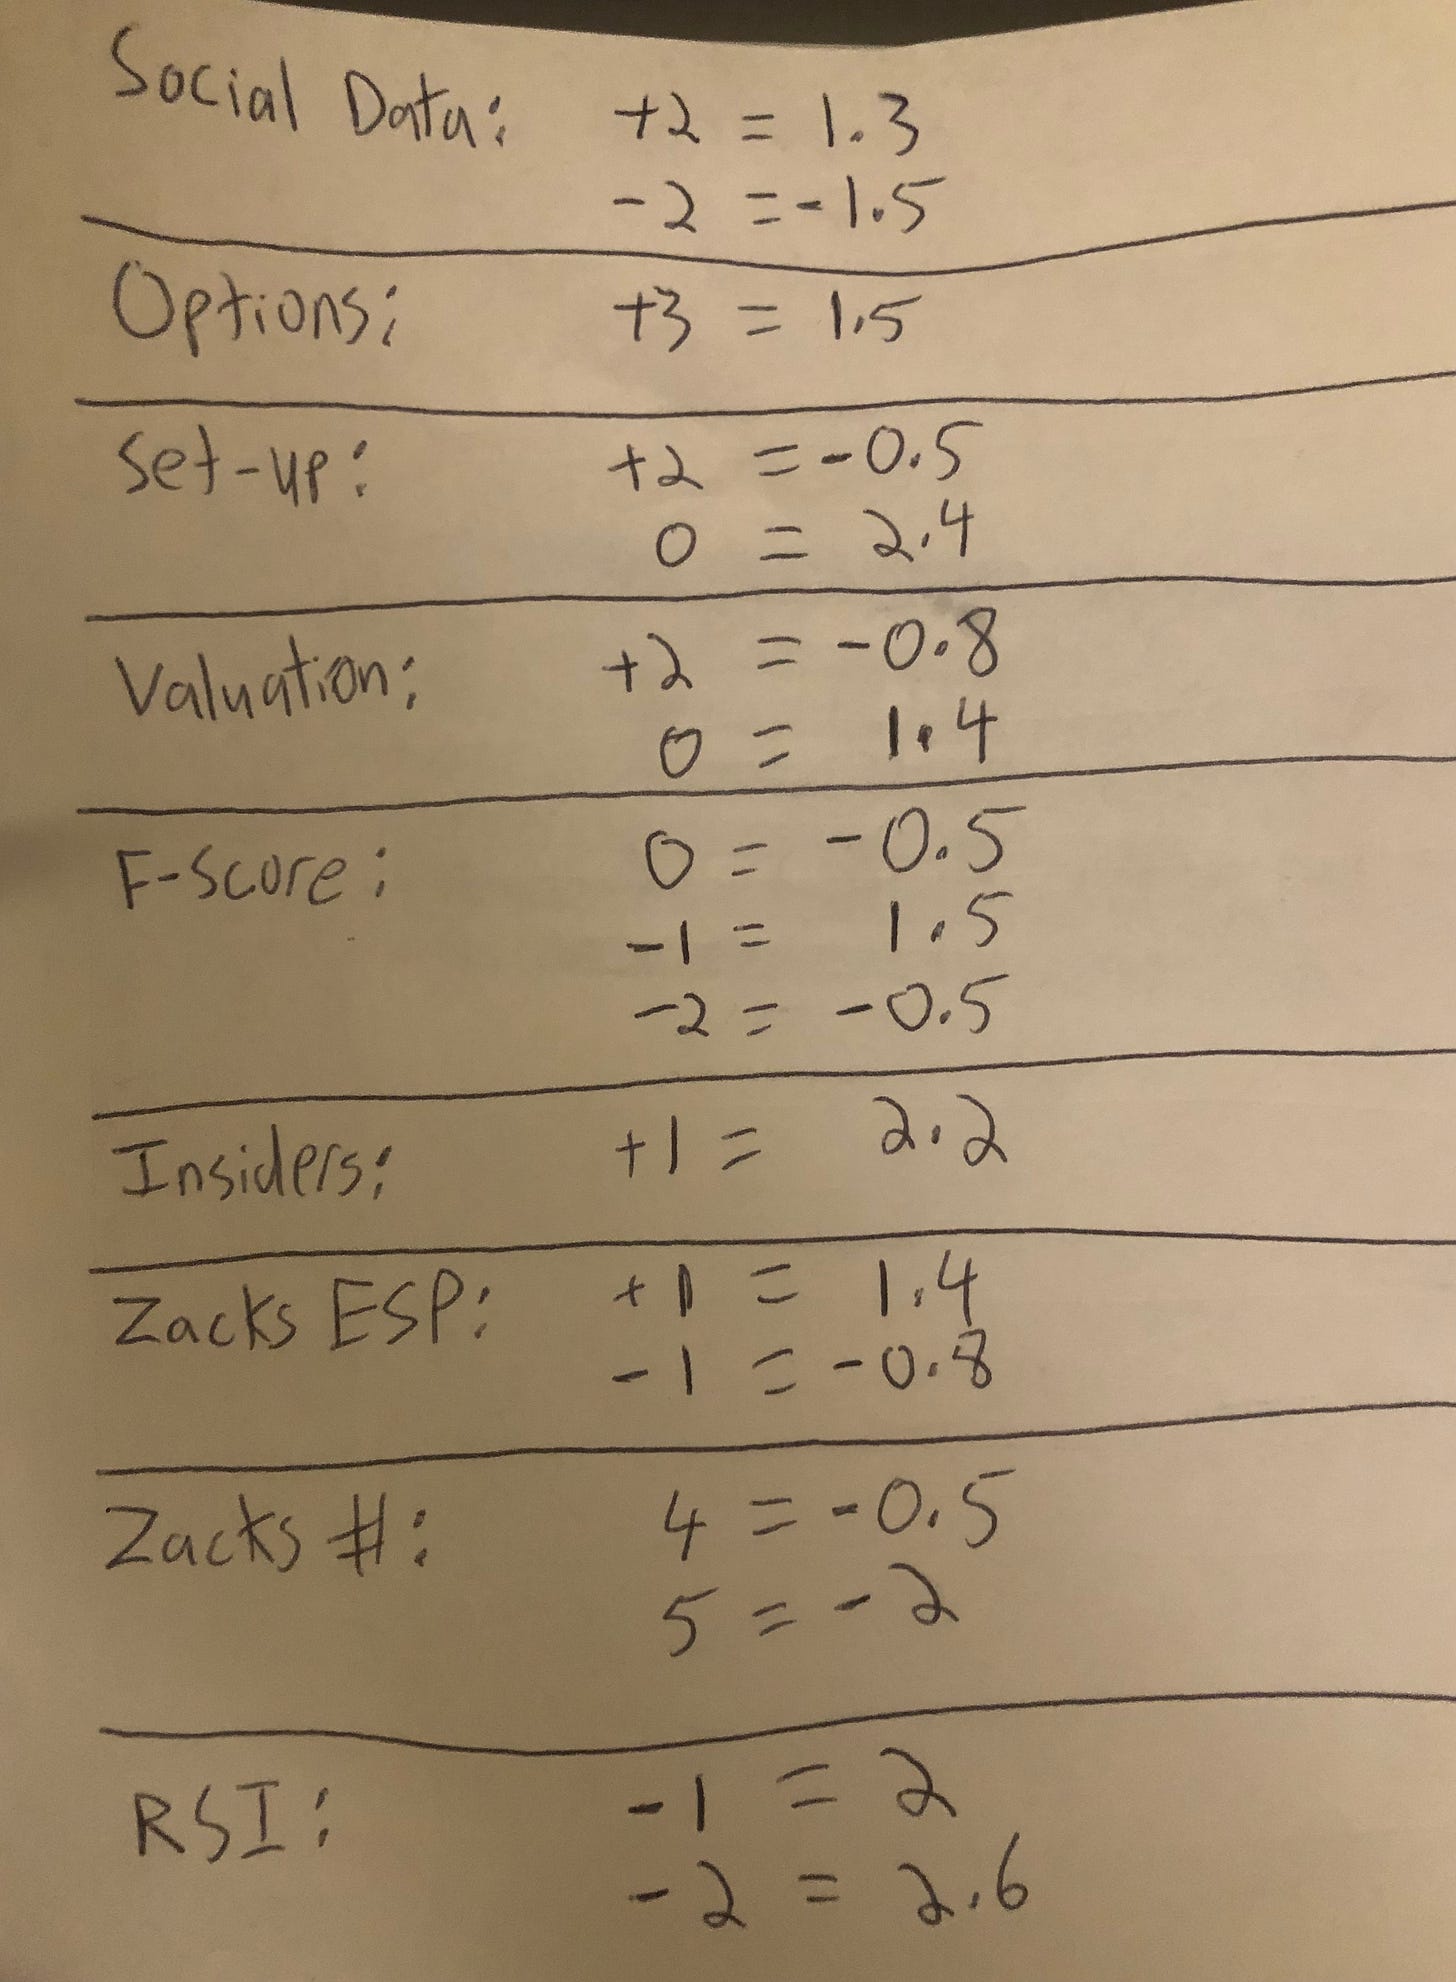
I use the data from that part of the spreadsheet to create a cheat sheet to calculate composite scores for stocks reporting earnings the next week. Here’s what that looked like this before last week:
Basically, I add up each of the numbers that apply for a given stock to get the composite score.
The Mistake
Last week, I ignored the counterintuitive social data result, where -3 stocks actually generated better-than-average returns, figuring it was an anomaly, due to low sample size. Instead, I calculated composite scores for these two stocks with -3 social data scores as if they had -2 social data scores.
DraftKings (DKNG) (-0.8)
Social data: -63
PA Options sentiment: Very Bullish
Setup rating: 3
Valuation rating: 1
F-Score: 5
Recent insider transaction(s): Net open market sales peaking last March.
Zacks ESP: -15.30%
Zacks Ranking: 3
RSI: 72
Short Interest: 4.36%
The Trade Desk (TTD) (-2)
Social data: -65
PA Options sentiment: Bullish
Setup rating: 6
Valuation rating: 2
F-Score: 7
Recent insider transaction(s): Net open market sales peaking last March.
Zacks ESP: 0%
Zacks Ranking: 4
RSI: 63
Short Interest: 3.09%
As a result, I ended up with the negative composite scores shown above in parentheses, placed bearish bets on them, and took 100% losses on them, as I detailed in last week’s Exits post.
Exits, 2/17/2024
Dids/Pexels This Week’s Trade Exits As soon as I exit a trade, I note that in the comments of the post where I first mentioned the trade; at the end of the week, I try to track them all in one post. These are the trades I exited this week: Stocks or Exchange Traded Products
What We’re Doing Differently This Week
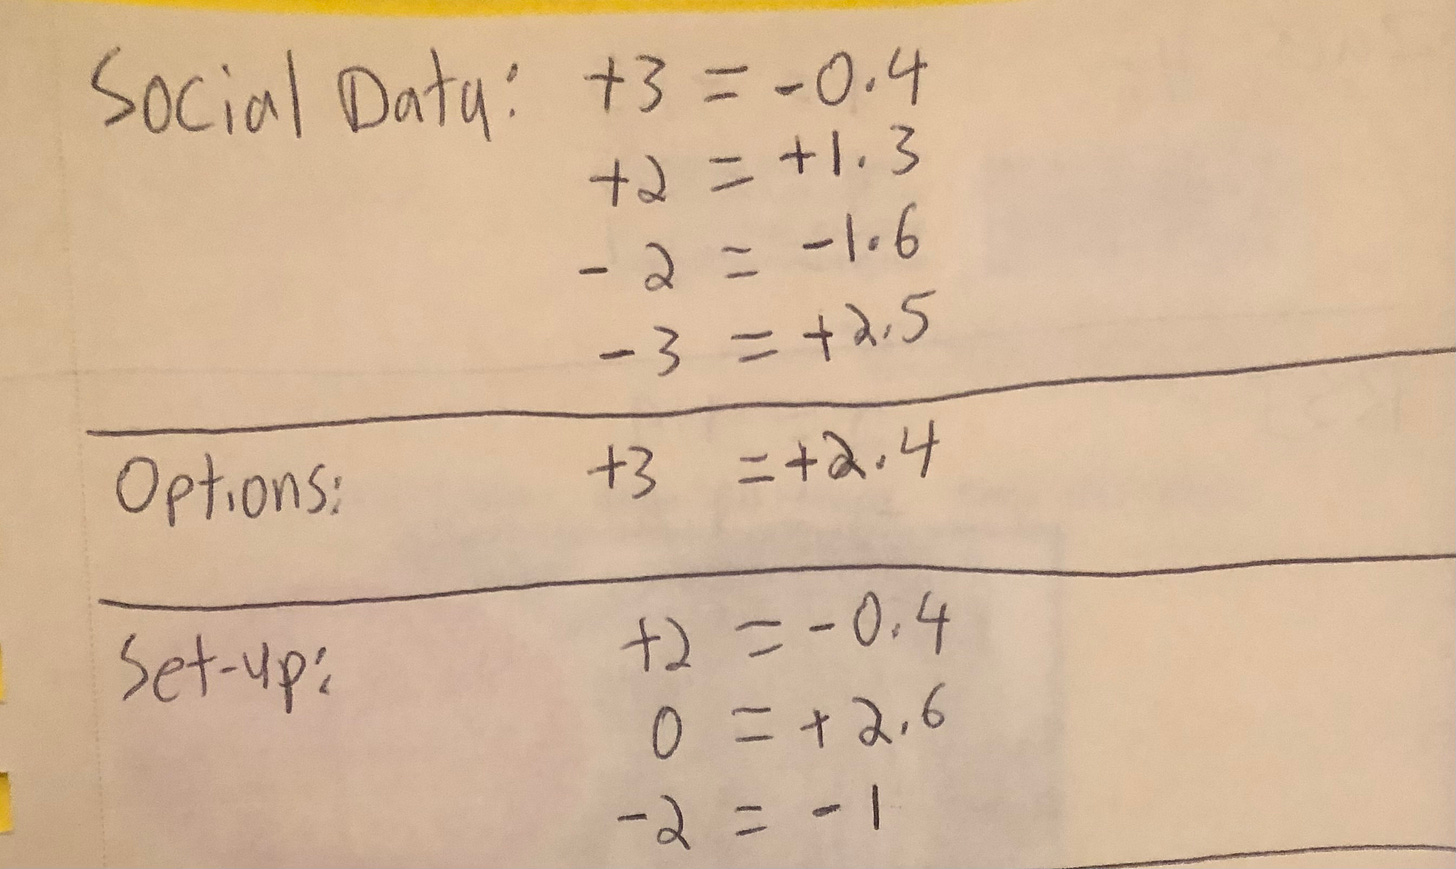
On this week’s cheat sheet, one of the changes is that a stock with a -3 social data score will get 2.5 added to its composite score (since stocks with -3 social data scores have posted 5-day returns 2.5x those of the average stock in our spreadsheet). Had we done that last week, we wouldn’t have bet against either of the two stocks above.


