


Trade Alert, 2/7/2024
Two bearish bets against companies reporting after the close today and before the open tomorrow.


Our Current Approach
Recall that we’re using these ten factors when evaluating earnings trades,
LikeFolio’s earnings score based on social data. The higher the number, the more bullish, the lower (more negative) the number, the more bearish.
Portfolio Armor’s gauge of options market sentiment.
Chartmill’s Setup rating. On a scale of 0-10, this is a measure of technical consolidation. For bullish trades, we want a high setup rating; for bearish trades, a lower one.
Chartmill’s Valuation rating. On a scale of 0-10, this is a measure of fundamental valuation incorporating common rations like P/E, PEG, EBITDA/Enterprise Value, etc. For bullish trades, the higher the better the Valuation rating the better; for bearish trades, the reverse.
Zacks Earnings ESP (Expected Surprise Prediction). This is a ratio of the most accurate analyst’s earnings estimate versus the consensus estimate.
Zacks Ranking. This goes from 1 to 5, with #1 ranked stocks being their most bullish ones. They grade on a bell curve, so most stocks we see end up with their #3 (neutral) ranking.
The Piotroski F-Score. A measure of financial strength on a scale from 0-9, with 9 being best.
Recent insider transactions.
RSI (Relative Strength Index). A technical measure of whether a stock is overbought or oversold. We’re looking for RSI levels below 70 for bullish trades and above 30 for bearish ones.
Short Interest.
And we’re keeping track of each metric on a range from very bearish to very bullish, and tracking them and their performance in a spreadsheet, a snippet of which is below.
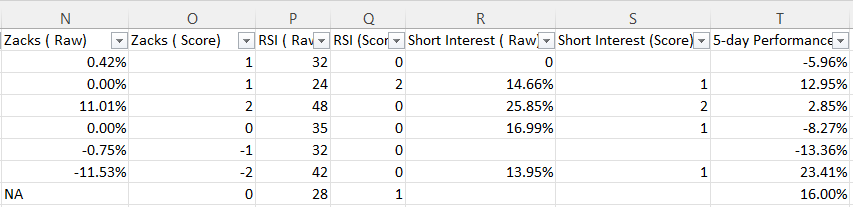
And we’re using their relative outperformance or underperformance versus all of the stocks that we’ve analyzed to adjust our weightings of each metric to determine which stocks we should be bullish or bearish on ahead of earnings.
The Stocks We’re Bearish On
The number in parentheses represents our composite score for a stock, based on all the metrics: higher = more bullish, and lower (more negative) = more bearish.
Bearish Stock #1 (-0.9)
Social data: -34
PA Options sentiment: Neutral.
Setup rating: 8
Valuation rating: 2
F-Score: 5
Recent insider transaction(s): None in the last 12 months.
Zacks ESP: 0%
Zacks Ranking: 3
RSI: 51
Short Interest: 2.29%
Bearish Stock #2 (-2)
Social data: -43
PA Options sentiment: Bullish.
Setup rating: 8
Valuation rating: 2
F-Score: 6
Recent insider transaction(s): Net open market sales in May and August.
Zacks ESP: 0%
Zacks Ranking: 2
RSI: 50
Short Interest: 8.78%
Details below.
Bearish Trade #1
Keep reading with a 7-day free trial
Subscribe to The Portfolio Armor Substack to keep reading this post and get 7 days of free access to the full post archives.