


Trade Alert: Earnings, 2/29/2024
Two bearish trades on companies reporting after the close, plus one post-earnings trade.


Note: so far, we’ve had three earnings trade exits this week:
Put spread on Macy’s (M -2.56%↓). Entered at a net debit of $0.23 on 2/26/2024; exited at a net credit of $0.27 on 2/28/2024. Profit: 17%.
Put spread on Keurig Dr. Pepper (KDP 0.00%↑). Entered at a net debit of $0.40 on 2/20/2024; exited at a net credit of $0.73 on 2/26/2024. Profit: 83%.
Put spread on Urban Outfitters (URBN 0.40%↑). Entered at a net debit of $0.46 on 2/27/2024; exited at a net credit of $0.94 on 2/28/2024. Profit: 104%.
Now on to today’s trade.
Our Current Approach
Recall that we’re using these ten factors when evaluating earnings trades,
LikeFolio’s earnings score based on social data. The higher the number, the more bullish, the lower (more negative) the number, the more bearish.
Portfolio Armor’s gauge of options market sentiment.
Chartmill’s Setup rating. On a scale of 0-10, this is a measure of technical consolidation. For bullish trades, we want a high setup rating; for bearish trades, a lower one.
Chartmill’s Valuation rating. On a scale of 0-10, this is a measure of fundamental valuation incorporating common rations like P/E, PEG, EBITDA/Enterprise Value, etc. For bullish trades, the higher the better the Valuation rating the better; for bearish trades, the reverse.
Zacks Earnings ESP (Expected Surprise Prediction). This is a ratio of the most accurate analyst’s earnings estimate versus the consensus estimate.
Zacks Ranking. This goes from 1 to 5, with #1 ranked stocks being their most bullish ones. They grade on a bell curve, so most stocks we see end up with their #3 (neutral) ranking.
The Piotroski F-Score. A measure of financial strength on a scale from 0-9, with 9 being best.
Recent insider transactions.
RSI (Relative Strength Index). A technical measure of whether a stock is overbought or oversold. RSI levels above 70 suggest a stock is overbought and and RSI levels below 30 suggest it’s over sold.
Short Interest.
And we’re keeping track of each metric on a range from very bearish to very bullish, and tracking them and their performance in a spreadsheet, a snippet of which is below.
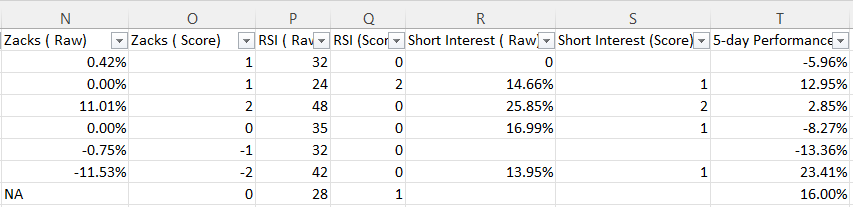
And we’re using their relative outperformance or underperformance versus all of the stocks that we’ve analyzed to adjust our weightings of each metric to determine which stocks we should be bullish or bearish on ahead of earnings.
The Stock We’re Bullish On
The number in parentheses represents our composite score for a stock, based on all the metrics: higher = more bullish, and lower (more negative) = more bearish.
Bullish Stock #1 (3.1)
Social data: +20
PA Options sentiment: Very Bullish.
Setup rating: 6
Valuation rating: 1
F-Score: 6
Recent insider transaction(s): Net open market sales peaking in December.
Zacks ESP: 54.34%
Zacks Ranking: 4
RSI: 61
Short Interest: 3.55%
This is our post-earnings trade, and those were the metrics on it before it reported earnings. It plummeted 20%, despite beating on top and bottom lines, on concerns about a CEO change. My view is that those concerns are overstated, so we’re going to bet on the company trading at least a little bit higher than its current price after its next earnings report.
The Stocks We’re Bearish On
The number in parentheses represents our composite score for a stock, based on all the metrics: higher = more bullish, and lower (more negative) = more bearish.
Bearish Stock #1 (-0.9)
Social data: -21
PA Options sentiment: Bullish.
Setup rating: 8
Valuation rating: 4
F-Score: 9
Recent insider transaction(s): Net open market sales peaking in December.
Zacks ESP: 0%
Zacks Ranking: 4
RSI: 50
Short Interest: 1.66%
Bearish Stock #1 (-0.4)
Social data: -39
PA Options sentiment: Bullish.
Setup rating: 7
Valuation rating: 3
F-Score: 6
Recent insider transaction(s): Modest net open market sales peaking last June
Zacks ESP: 0%
Zacks Ranking: 2
RSI: 55
Short Interest: 4.74%
A note about the composite score on this one: If the social data score here were -40 instead of -39, the composite score would have been -2.1. I’m not sure in practice there’s much difference between a -39 and -40 social data score: -40 is just my cutoff from “bearish” to “very bearish” for tracking purposes.
Details below.
Bullish Trade #1
Keep reading with a 7-day free trial
Subscribe to The Portfolio Armor Substack to keep reading this post and get 7 days of free access to the full post archives.