The Threat Of A Spreading War
In our Zero Hedge post yesterday (The Guns Of October) we wrote about the risk of the current Mideast war spreading and mentioned one way to limit your risk in light of that: hedging the stocks or ETFs you own.
Here we'll look at another approach, the hedged portfolio construction method, and show you a real world example of it.
The Hedged Portfolio Method
The basic idea here is to buy and hedge a handful of promising names that are relatively inexpensive to hedge. Here's the process we use do that:
Estimate potential returns over the next six months for every security with options traded in the U.S.
Calculate the least expensive way of hedging each of those securities while capturing that estimated return.
Subtract the hedging cost from the estimated returns, and rank the names by estimated return net of hedging cost.
Buy and hedge and handful of the top names.
There's a bit more to the process than that--we also include a step to minimize cash, since everything's hedged--but that's the basic idea.
Sounds Difficult?
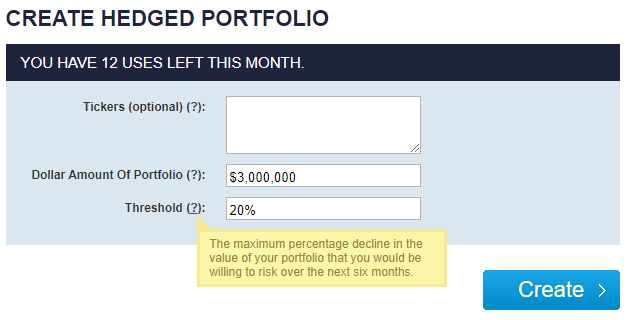
Manually, it would be. But we use an automated system where you just type in the amount of money you want to invest, the largest drawdown you're willing to risk, and our portfolio construction algorithm does the rest.
The interface looks like this.
A Real World Example
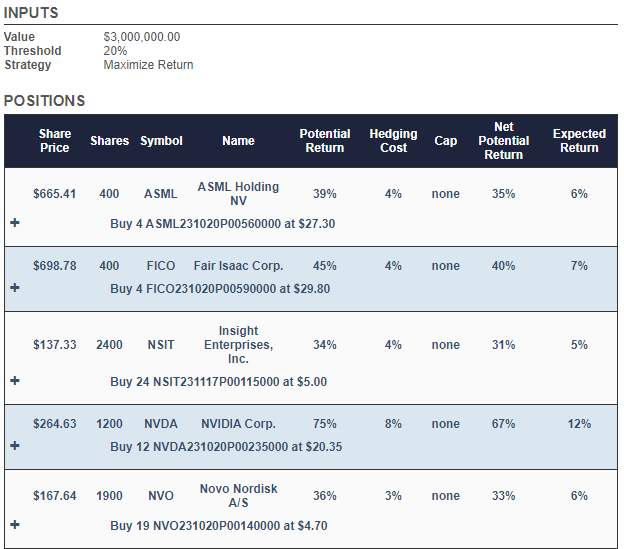
And this is the portfolio our site created for an investor entering that info on April 13th, someone with $3,000,000 to put to work who wasn't willing to risk a decline of more than 20% over the next six months:
Screen captures via the Portfolio Armor web app.
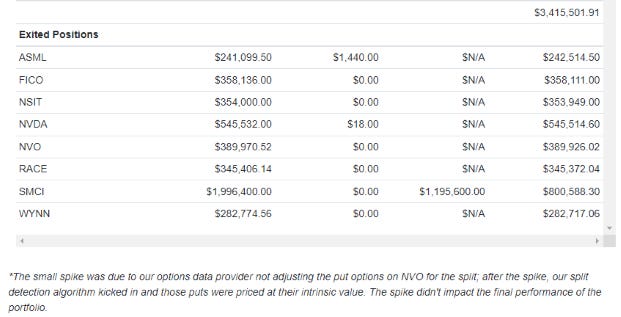
ASML Holding N.V. ( ASML 0.00%↑ ) and Fair Isaac Corp (FICO 0.00%↑), Insight Enterprises, Inc. (NSIT 0.00%↑), NVIDIA Corp. (NVDA 0.00%↑), Novo Nordisk A/S (NVO 0.00%↑), Ferrari NV (RACE 0.00%↑), and Wynn Resorts, Ltd. (WYNN 0.00%↑) were the stocks that came to the top of that ranking we mentioned above: estimated returns net of hedging cost. Our site started with rough equal dollar amounts of both, and then rounded them down to round lots, to lower hedging cost. Then it put most of the cash leftover from that rounding-down process into a tightly hedged position in Super Micro Computer, Inc. (SMCI 0.00%↑), that generated a net credit of about 12%.
How That Hedged Portfolio Did
Over the next six months, that hedged portfolio was 13.85up %, net of hedging and trading costs, versus 5.18% for the SPDR S&P 500 Trust ETF (SPY).
Click here to see an interactive version of the chart above.
Expect Some Variability Of Returns
You're going to get more variability of returns with this approach than you would by indexing, as you would expect from a concentrated portfolio. But you'll never be down more than the risk tolerance you indicated ahead of time. For example, the portfolio our site created for an investor with the same inputs a week earlier ended up returning about 7.3% over the next six months.
One way to even out this sort of variability is to split your money into a couple of tranches and put half to work now, and the other half to work in two or three months. That way, the higher returning portfolios will offset the lower returning portfolios.


