Slyzyy/Pexels
This Week’s Trade Exits
As soon as I exit a trade, I note that in the comments of the post where I first mentioned the trade; at the end of the week, I try to track them all in one post. These are the trades I exited this week:
Stocks or Exchange Traded Products
None.
Options Trades
None.
Comments
This was another week with no trade exits, so let’s talk performance, specifically or our top ten names, and our hedged portfolios. Each week, I post the top ten names from the Portfolio Armor website here as part of our core strategy (which is buying and holding the top ten with trailing stops, and replacing them with new top names as we get stopped out).
Top Names, 6/29/2023
A Quick Trading Update Before we get to this week’s top names, a quick options trading update. In general, I usually wait until an options trade fills before posting about it, with two exceptions: If the trade alert includes more than one trade, and one of those trades has filled, I post it as soon as the first one gets filled.
Top Ten Names Performance
On the Portfolio Armor website, we track performance of our top names and hedged portfolios over six-month periods. Here’s how our top ten names from December 29th did over the next six months:
As you can see, they more than doubled the performance of the SPDR S&P 500 Trust tracking ETF (SPY 0.00%↑) over the time period, led by picks & shovels AI names Super Micro Computer (SMCI 0.00%↑) and Rambus (RMBS 0.00%↑).
Hedged Portfolio Performance
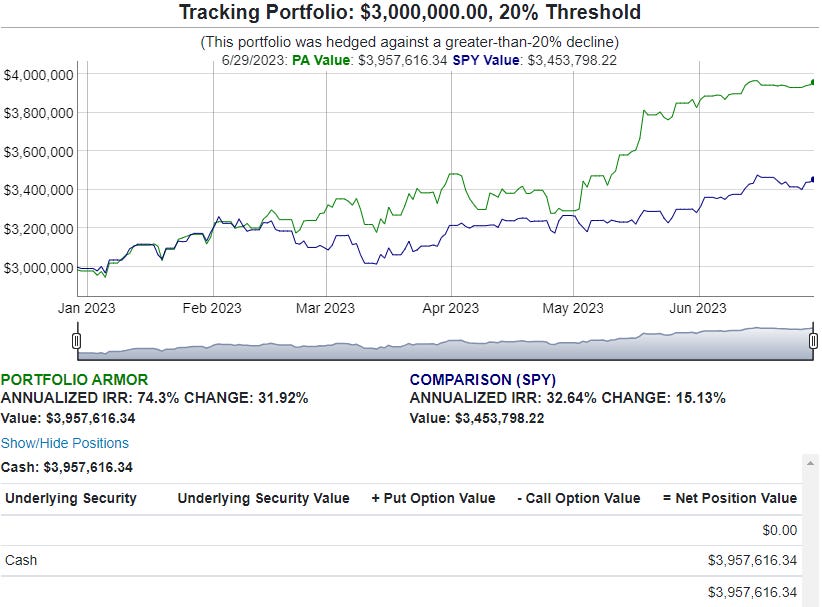
On the PA website, we use these top ten names as starting points when creating hedged portfolios for investors. This was a hedged portfolio created on December 29th for an investor with $3 million who was unwilling to risk a decline of more than 20% over the next six months:
The bottom seven names in this hedged portfolio were selected because they were the ones with the highest estimated potential return, net of hedging costs, when hedging against >20% declines. Our site started with equal dollar amounts of each, and then rounded them down to round lots (numbers divisible by 100), to lower hedging costs. Then it used a tightly collared position in Ambarella (AMBA 0.00%↑) to absorb most of the leftover cash from that rounding-down process.
The expected return, as you can see in the portfolio summary at the bottom of the image below, was 8%, and the “net potential return” (estimated maximum return, net of hedging cost) was 30%. Here’s how the portfolio actually did:
Net of hedging and trading costs, this portfolio was up 31.92%, versus a 15.13% return for SPY. You can find an interactive version of the chart above here.
You Can Do This Instead
The options trades we do here are high risk, which is why I suggest using a smaller position sizing for them. E.g., if you were going to invest $ X in a stock with a 10% trailing stop, you shouldn’t put more than $0.1X in a long options trade. On long options trades, particularly ones when the expiration date is months out, there’s an excellent chance you will see a lot of red in your brokerage account before we exit the trade, and if you can’t tolerate seeing that, consider our hedged portfolio approach instead. The example above shows a $3,000,000 portfolio, but it works for portfolios as small as $30,000. You need to be a subscriber to the Portfolio Armor website to create hedged portfolios, but website subscribers get complementary paid access to this Substack as well (they just have to email me to request it).


