Calmly looking at her hedged portfolio results.
Another Approach
If you read our most recent Exits post, you noticed we took 100% losses on a number of trades we had entered over the last several months, that expired out of the money on Friday.
That happens with this sort of options trading, which is why we keep our position sizes small. I’m as transparent about those losses as I am about the wins, and how I’m trying to improve the process to get us more wins. That said, we’re always going to have individual trades that expire worthless with this approach.
Here’s another approach that may be of interest if you are more conservative by temperament or (for my financial professional readers) have clients who are.
The Hedged Portfolio Method
Each week I post the Portfolio Armor website’s top ten names, most recently here:
Those top names come from a daily ranking of every security with options traded on it in the U.S., where Portfolio Armor’s algorithm estimates their potential returns over the next six months, net of hedging costs.
The hedged portfolio method starts with that ranking, and then takes into account your risk tolerance and the dollar amount you plan to invest, and constructs a portfolio designed to maximize your returns over the next six months while strictly limiting your risk according to your risk tolerance.
A Real World Example
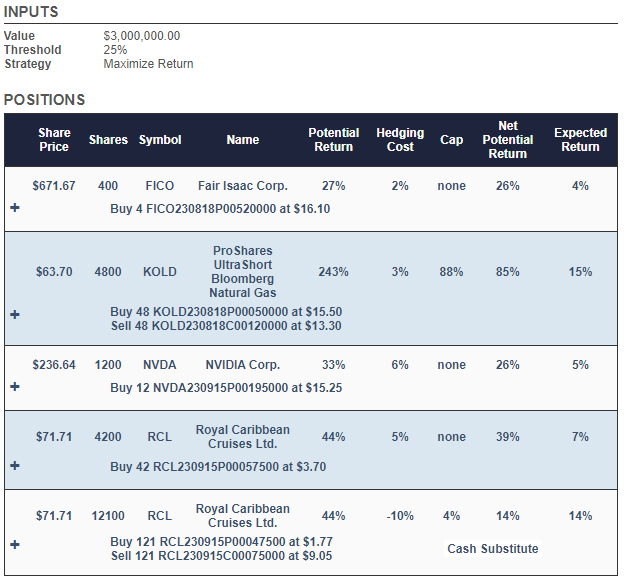
Let’s say you had $3,000,000 to invest on February 24th of this year, and were unwilling to risk a decline of more than 25% over the next six months (the hedged portfolio method works for portfolios as small as $30,000, too, but here were using a larger example).
This is the portfolio Portfolio Armor presented to an investor in that situation then:
Screen captures via Portfolio Armor on 2/24/2023
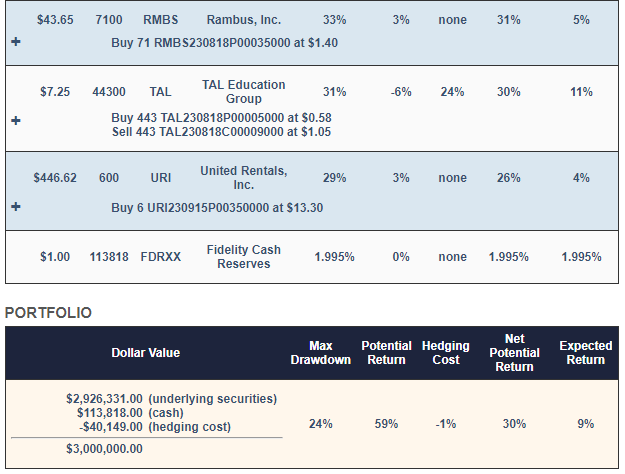
The site started by putting equal dollar amounts into 7 top names, and then it rounded those dollar amounts down to round lots (share counts divisible by 100) to lower hedging costs. Then it swept most of the leftover cash from that process into a tightly collared position in Royal Caribbean Cruises (RCL 0.00%↑).
Next it used an algorithm to determine whether to hedge each position with optimal puts or an optimal collar, by estimating which way was likely to generate higher returns net of hedging costs. As you can see above, in most cases, the puts one out.
The maximum drawdown with that portfolio was a drop of 24%, and the expected return was 9% over six months.
Actual Performance Of That Portfolio
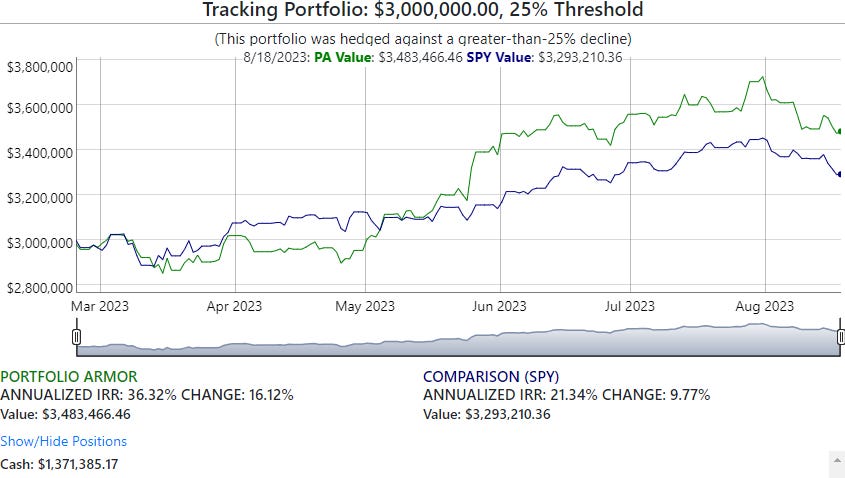
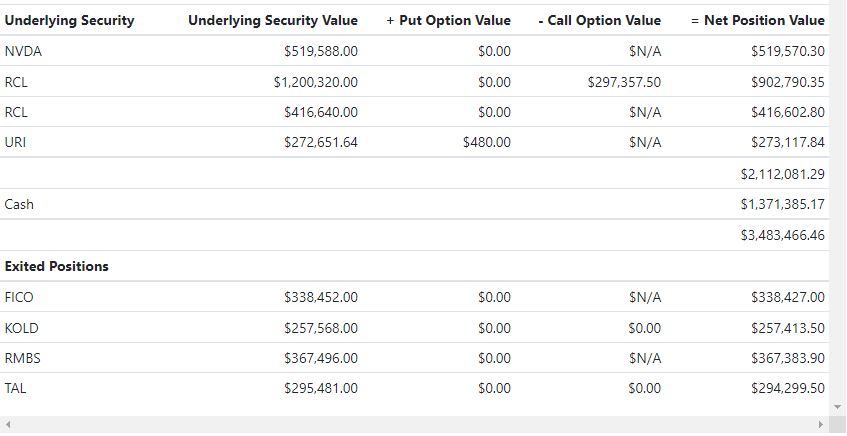
That portfolio doesn’t mature until 8/24, but here’s how it has done so far, as of Friday’s close: up 16.12%, net of hedging and trading costs, versus up 9.77% for the SPDR S&P 500 Trust ETF (SPY 0.00%↑).
Half of the positions in the portfolio had options expiring on Friday, so our tracking program exited those positions then (the idea is to hold each position for six months or until just before its options expire, whichever comes first).
You’re obviously not going to beat the market all the time with this approach, but the performance of the portfolio above isn’t anomalous: 7 of the most recent 10 portfolios hedged against the same decline have outperformed the market.
Something to consider, if a more conservative, less hands-on approach appeals to you (you can use Portfolio Armor to construct portfolios hedged against declines as small as 2%, though of course those will offer more modest returns).


